[home] [algorithm] [results] [code] [references] [links]
Denoising Results
On this page some results on the denoising performance are given. The quality of the reconstruction is measured in dB by the Peak Signal to noise ratio PSNR(I1,I2) = 20 * log10(255/sqrt(MeanSquareError(I1,I2)). However the quality of an image reconstruction is highly subjective therefore this number might not represent the opinion of every "viewer". At the end of this page some sample images are shown where you can have a look at the reconstruction.
Results
QMF-9 - separable orthonormal Quadrature Mirror filter wavelet pyramid
SFpyr - Steerable Wavelet pyramid
FullSFpyr - as SFpyr but with additionally oriented highpass residuals
In each experiment an image was contaminated with independent Gaussian pixel noise of some predetermined variance. The noisy image was decomposed into a wavelet pyramid representation. We used three different wavelet pyramids, namely a Quadrature Mirror Filter, the steerable Wavelet pyramid and a steerable wavelet pyramid where the high pass residual is split into oriented subbands (as reported in [4]). To reduce artifacts at the image boundaries we used reflective boundary extensions. During denoising 20 iterations of the IWF filter were used.
The estimation of the local moments was done by collecting samples in a 11x11 neighborhood surrounding the coefficient of interest. Whenever no estimate for α was available it was set to 0.5.
Results
|
noise var |
1 | 2 | 5 | 10 | 15 | 20 | 25 | 50 | 75 | 100 |
| Lena | 48.28 | 32.22 | 37.78 | 34.45 | 32.58 | 31.25 | 30.24 | 27.20 | 25.49 | 24.35 |
| Barbara | 48.27 | 34.11 | 37.05 | 32.93 | 30.51 | 28.98 | 27.75 | 24.41 | 22.64 | 21.76 |
| Boat | 48.09 | 42.72 | 36.38 | 32.60 | 30.64 | 29.23 | 28.20 | 25.27 | 23.79 | 22.75 |
| Fingerprint | 47.96 | 42.50 | 35.77 | 31.41 | 29.21 | 27.74 | 26.66 | 23.35 | 21.60 | 20.40 |
| House | 48.67 | 43.85 | 38.16 | 34.33 | 32.28 | 30.92 | 29.96 | 26.60 | 24.87 | 23.47 |
| Peppers | 48.24 | 42.97 | 36.85 | 32.92 | 30.68 | 29.13 | 28.01 | 24.61 | 22.68 | 21.46 |
The results are averaged over 5 independent runs. Description see above.
| 1 | 2 | 5 | 10 | 15 | 20 | 25 | 50 | 75 | 100 | |
| Lena | 48.56 | 43.41 | 38.30 | 35.42 | 33.82 | 32.61 | 31.62 | 28.54 | 26.75 | 25.48 |
| Barbara | 48.60 | 43.36 | 37.63 | 33.88 | 31.77 | 30.32 | 29.20 | 25.60 | 23.87 | 22.77 |
| Boat | 48.35 | 42.80 | 36.59 | 33.11 | 31.39 | 30.18 | 29.20 | 26.27 | 24.63 | 23.57 |
| Fingerprint | 48.31 | 42.72 | 36.39 | 32.35 | 30.01 | 28.46 | 27.34 | 24.14 | 22.45 | 21.30 |
| House | 48.95 | 44.16 | 38.52 | 35.24 | 33.47 | 32.21 | 31.25 | 28.11 | 26.26 | 24.90 |
| Peppers | 48.49 | 43.16 | 37.29 | 33.57 | 31.52 | 30.13 | 28.99 | 25.72 | 23.83 | 22.46 |
The results are averaged over 5 independent runs. Description see above.
| 1 | 2 | 5 | 10 | 15 | 20 | 25 | 50 | 75 | 100 | |
| Lena | 48.65 | 34.53 | 28.51 | 35.60 | 33.89 | 32.62 | 31.64 | 28.58 | 26.74 | 25.53 |
| Barbara | 48.70 | 43.59 | 28.06 | 34.40 | 32.32 | 30.86 | 29.69 | 26.12 | 24.12 | 22.90 |
| Boat | 48.46 | 43.09 | 37.05 | 33.49 | 31.58 | 30.28 | 29.24 | 26.27 | 24.64 | 23.56 |
| Fingerprint | 48.44 | 43.02 | 36.66 | 32.35 | 30.02 | 28.42 | 27.31 | 24.15 | 22.45 | 21.28 |
| House | 49.06 | 44.32 | 39.00 | 35.54 | 33.67 | 32.37 | 31.33 | 28.15 | 26.12 | 24.84 |
| Peppers | 48.50 | 43.20 | 37.40 | 33.79 | 31.74 | 30.29 | 29.16 | 25.69 | 23.85 | 22.50 |
The results are averaged over 5 independent runs. Description see above.
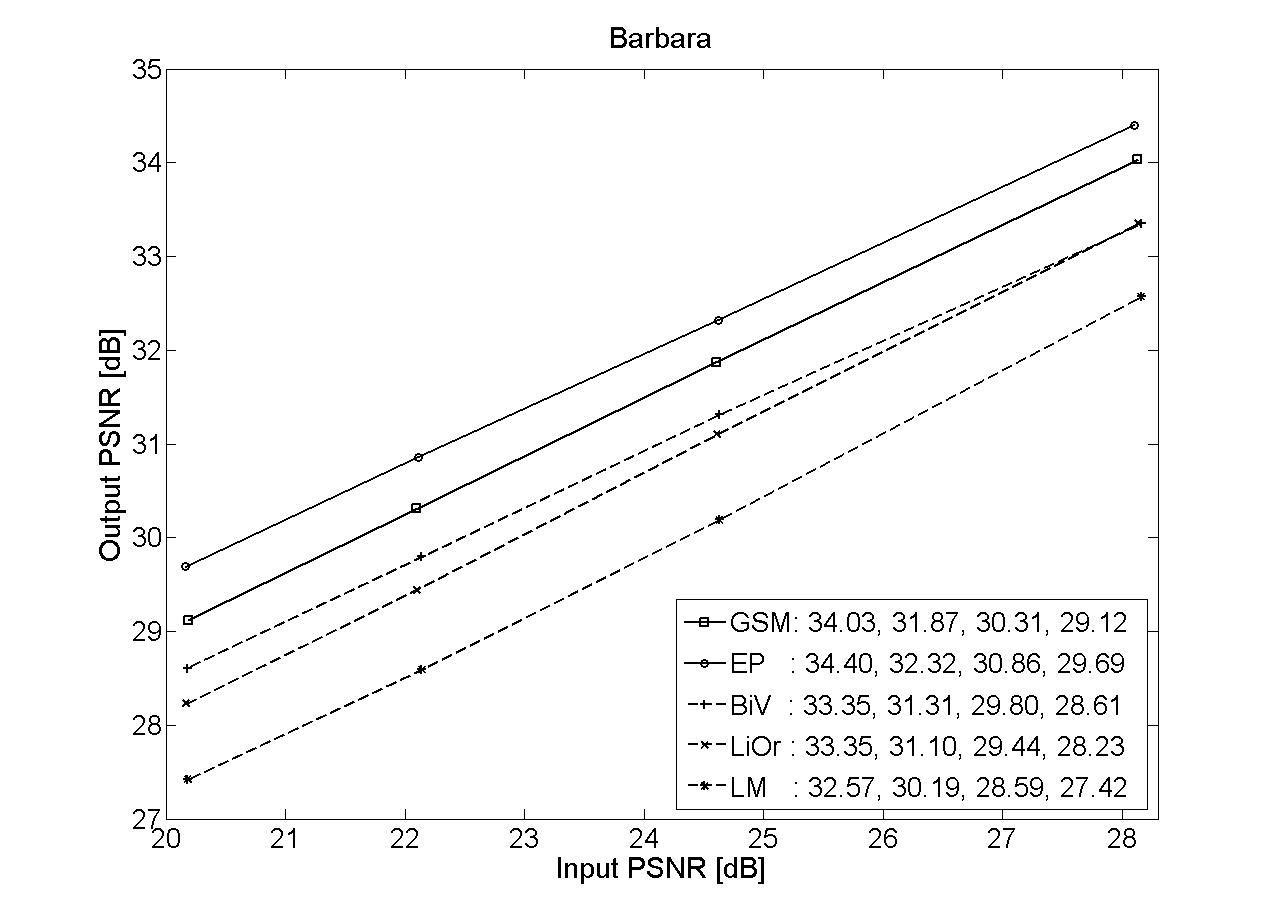
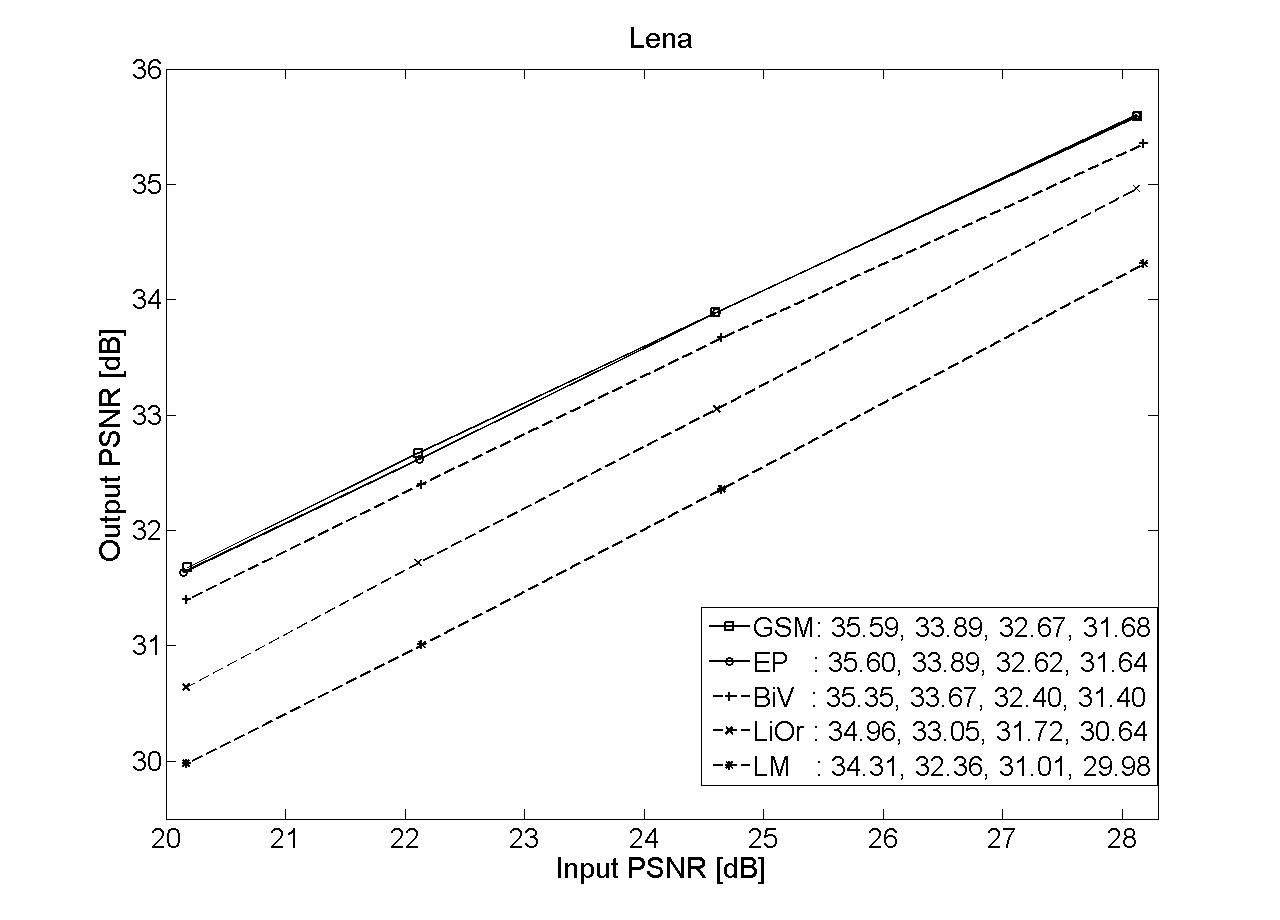
In the following two figures the performance of the denoising algorithm is plotted in output PSNR as a function of input PSNR. GSM [4], BiV [2], LiOr [8] and LM [9]. The settings for the PoEdges are described above. For this limited range of noise variances we see that the PoEdges performs best on Barbara and ties with the GSM method on the Lena image.
|
|
The raw PSNR value might not reflect the quality of the reconstruction of an image. Therefore one should also inspect the images to access the difference between the GSM and the PoEdges method. Although the results are quite similar, it seems that the PoEdges is a bit more blurry but introduces less artifacts than the GSM method.
Peter Gehler http://www.kyb.mpg.de/~pgehler
Max Welling http://www.ics.uci.edu/~welling/